

| THE WORLD AS WE SAW IT IN OCTOBER 2025 |
| The World of Cryptocurrencies |
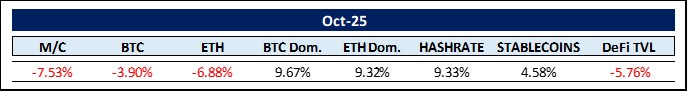
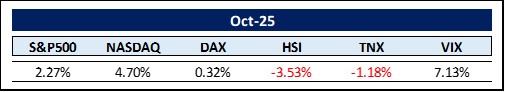
2025 appears to be the year we clear out old memes. Neither Rektember (market was up 4.34%) nor Uptober (market down 7.53% ) came to pass. It also seems that the 4-year bitcoin cycle is broken (more on this below). But it does not stop in the crypto world. The stock market adage “Sell in May and go away” has certainly lost its luster, with the NASDAQ Composite up 33.95% and the S&P 500 up 20.98% since May 1.
Granted, much of the meme rattling may have to do with Nassim Taleb’s black swans suddenly turning orange (by the way, this month’s cover image does not carry a political message, as we at Make-It are completely apolitical. We analyze political decisions only as they directly impact our investment choices. Adding a little humor in crazy times doesn’t hurt, either…). Swan events can be either positive or negative. In this case, DJT heralded additional 100% tariffs on Chinese imports (on top of the existing 30%) in a retaliatory move addressing China’s renewed reluctance to freely ship its precious rare earths to the US. According to U.S. Vice President JD Vance, however, this was all just a big misunderstanding. Be that as it may, this apparent miscommunication between the Trump administration and China triggered the largest 24-hour liquidation event in crypto history, affecting $19.3 billion in leveraged positions and resulting in over $560 billion in market capitalization losses on October 10–11, 2025.
Leveraged long positions – bets on rising prices – accounted for $16.7 billion of the $19.3 billion in liquidations, according to CoinGlass data, affecting over 1.6 million traders and marking the biggest single-day wipeout ever, easily surpassing events like the 2022 FTX collapse and the 2020 COVID crash. As the Irish playwright George Bernard Shaw (1856–1950) said, “The single biggest problem in communication is the illusion that it has taken place.” I feel for those 1.6 million traders. Anyhow, albeit in record territory, this dramatic sell-off appears to mirror previous ones. Such declines typically remove excess, reset sentiment, and clear the way for the next move higher.
Nevertheless, in light of the severity of the sell-off on October 10, we need to delve deeper to understand what enabled these cascading and record-breaking losses. To do so, we need to examine the perpetual futures (perps) market.
The invention is credited to Arthur Hayes at BitMEX in 2016. Before perps, crypto futures had expiry dates, requiring traders to roll over positions and causing friction. Perpetual contracts solved this with an indefinite holding period and the introduction of the funding rate mechanism, where every 8 hours longs pay shorts (or vice versa) to keep the price anchored to spot, addressing convergence issues. Arthur Hayes said, “We invented perps because quarterly futures were stupid for crypto. No expiry = infinite leverage without the hassle.” The introduction was a remarkable success. By 2018, perps accounted for 95% of BitMEX’s $3.5 trillion annual volume. Meanwhile though, about 52% of total perp volume is traded on Binance (which might account for its struggles holding certain pegs during the turmoil). Anyhow, we need to know more details about how perps function in order to better understand the market meltdown on October 10.
Perps are derivative contracts that track the price of cryptocurrencies without involving direct ownership or transfer of the underlying assets. No crypto is directly bought or sold; perps are simply bets between buyers and sellers managed by exchanges. It is not immediately obvious why events in the perps market should affect the crypto market whatsoever — after all no crypto was directly involved. Doug Colkitt from Crocodile Labs said: “When you have a perps market like BTC, a fun fact is there’s no actual BTC in that system at all. There’s just a big pile of cash sitting doing nothing.” The pile of cash moves back and forth between players, but it always nets out to zero: “The beautiful thing about perps markets is they’re all zero-sum, so the system can never be insolvent in the aggregate.” But why would money shifting between players in the perps market cause the market they’re betting on to crash? According to Colkitt the perps market is not hermetically sealed — somehow, the outcomes there leak into the world of “real” crypto.
There are several reasons for this – let’s highlight them one by one. Perps are a leverage-amplified sentiment machine. They act as an “emotional thermostat” for crypto markets – when traders go wild on perps, spot follows. As Arthur Hayes puts it: “Perps aren’t derivatives – they’re the market. Spot is the shadow.”
Why – one might rightfully ask? For starters, the perps market is significantly larger than the crypto spot market. Perps have volume dominance as they trade $3-5 trillion per month compared to spot’s $500 billion. This gap continues to widen due to perps’ leverage, flexibility, and appeal to active traders. Speaking of leverage. As traders can take on as much as 100x leverage, a liquidation cascade can get set off rather easily. And such an avalanche-like forced buying and selling hits spot markets directly. For example, in April 2025, a relatively small forced long liquidation of $800 million caused spot BTC to fall 8% within 2 hours.
Additionally, perps function as a sentiment multiplier. When whales pump or dump on perps, retail FOMO follows in the spot market. A correlation of 0.85 has been measured, meaning that when perps open interest (OI) spikes 20%, spot rallies 17% within 24h and vice versa. However, there are two more, less obvious influences: Auto-Deleveraging (ADL) and Cross Collateralization (cross-margening).
In the perps market, we encounter a very unusual mechanism – Auto-Deleveraging (ADL) – which, according to a recent article by Byron Gilliam, caused nearly all of crypto to crash on October 10. ADL is a risk management mechanism used by cryptocurrency exchanges to maintain market stability during extreme volatility. Perp traders use high leverage, creating zero-sum positions where one side’s gain is another’s loss. When a position’s losses exceed its margin and the exchange liquidates it, the same exchange’s insurance fund covers the shortfall to prevent the trader from owing more than their deposit. However, if the insurance fund is depleted or insufficient – such as during a rapid 30% drop in eight hours or overwhelming liquidation volume, as occurred on October 10 – ADL activates as a last resort. => It forcibly reduces or closes profitable opposing positions to offset losses, ensuring the platform’s solvency without socializing losses across all users. ADL is controversial because it can clip winning trades at inopportune moments, but it is essential for preventing cascading failures in leveraged markets.
The situation is exacerbated when traders enter cross-margined positions. Cross-margining ties multiple assets (e.g., BTC, ETH, altcoins) to one collateral pool. A sharp move in one (such as BTC dropping 10%) can force liquidations in others, spreading downside cascading volatility. In other words, some players at the perps poker table were betting with chips they had also pledged as collateral elsewhere – apparently to buy crypto tokens in the spot market with borrowed money. Therefore, when they lost their collateral playing in perps, they had to sell the spot positions it was also financing. That is exactly what happened on October 10. Traders became too greedy, taking on excessive leverage and even cross-collateralizing margin positions to maximize their trading potential. It took just one orange swan event to trigger a self-reinforcing downward tsunami, wiping out 1.6 million leveraged traders in 24 hours. No, Gordon Gekko – Greed is not Good.
As mentioned above, I’d like to highlight Bitcoin’s 4-year cycle – or rather, the breaking of it – as this was also a recurring theme at this year’s DAS London (Digital Assets Summit London Oct 13.-15.). First, the basics: Bitcoin’s 4-year cycle is tied to its halving events that reduce mining rewards by about half every 210,000 blocks, and has been one of the most reliable patterns in crypto history. Typically, the cycle unfolds as follows: a pre-halving rally, post-halving accumulation, a bull market peak about 12–18 months after the halving, and then a 70–80% bear market drawdown leading to the next cycle. This pattern played out clearly in 2012–2016, 2016–2020, and 2020–2024, with peaks at approximately $1,100 (2013), $20,000 (2017), and $69,000 (2021).
However, based on data through October 2025 (18 months after the April 2024 halving), although breaking the Uptober meme and BTC losing some 3.9%, it appears the cycle has been broken – not in the sense that Bitcoin’s price action is chaotic, but because its drivers have fundamentally changed. It’s no longer a self-contained, supply-shock-driven rhythm; it’s increasingly influenced by global macroeconomics, institutional flows, and regulatory tailwinds. October ETF inflows into Bitcoin were a healthy $3.4 billion, while Ethereum attracted $570 million into its US ETFs. All of this doesn’t mean the end of bull and bear phases, but the 4-year cycle now seems obsolete.
Some, such as CryptoCon and Rekt Capital, argue the cycle remains but has stretched to five years, peaking in late 2025 or early 2026 at $130,000–$180,000. There are parallels: historically, bull markets lasted about 1,064 days; from the 2023 lows, that would end in December 2025. The 4-year cycle isn’t dead like a flatline – it has matured into something more macro-correlated and less volatile, resembling gold or tech stocks more than a meme coin. I expect shallower drawdowns (20–40% instead of 70-80%), longer bull markets (potentially into 2026–2027 or even longer), and peaks driven by inflows (total on-chain stablecoin transfer volume rising significantly) rather than hype. Consequently, I wouldn’t bet everything on a November 2025 top – that’s outdated thinking. This shift is healthy: it means Bitcoin is graduating from speculative toy to global asset.
The Crypto-Anarchist Eric Cason put it with astonishing foresight in 2021: “Bitcoin becomes a teenager today. Over the next five years Bitcoin will transition from childish fantasies of personal riches, to the adult responsibility of the wealth of the world. It is the coming of age of an idea whose time has come and can no longer be stopped.”
Moving on to stablecoins. A new Andreessen Horowitz (a16z) State of Crypto report (link at the end of this Edition #52) finds that total stablecoins ($314 billion market cap) now account for over 1.65% of US M1 money supply (narrowest measure of the money supply: total currency in circulation + demand and checkable deposits = $18.9 trillion as of August 2025) as institutions and fintechs such as BlackRock, Visa, Fidelity, JPMorgan Chase, alongside Stripe, PayPal, and Robinhood get involved in crypto land. Since the passage of the GENIUS Act, stablecoin adoption has been remarkable. Business-to-business (B2B) payments using stablecoins have already increased by 70% in just a few months as a result of the passing of the GENIUS Act. As mentioned elsewhere, the next big catalyst will be the approval of the CLARITY Act.
a16z’ report also cited $9 trillion in adjusted stablecoin transactions over the past 12 months – an 87% increase from the previous year. On an unadjusted basis, stablecoin transactions even reached $46 trillion over the same period. This discrepancy calls for some clarification.
According to Cointelegraph, unadjusted volume is the raw, total value of all transactions recorded on the blockchain for a given stablecoin. It includes all transfers, regardless of purpose, such as peer-to-peer transfers, exchange deposits and withdrawals, arbitrage, spam transactions, and self-transfers (for example, someone moving funds between their own wallets). This raw volume can be inflated by non-economic or redundant activities, making it less representative of actual economic value transfer.
Adjusted volume, on the other hand, is a filtered metric that aims to reflect only economically meaningful transactions. Adjustments may use algorithms or heuristics to identify and remove non-economic transactions, providing a clearer picture of the stablecoin’s actual use in payments, trading, or other real-world applications.
In any case, the largest payment network remains ACH (Automated Clearing House), a US-centric electronic network for processing financial transactions between banks, used for direct deposits (paychecks, tax refunds), bill payments, person-to-person transfers (like Venmo or Zelle), and business payments. Total ACH transaction volume over the last 12 months was $87 trillion. For context, Visa achieved $16 trillion, and PayPal $1.7 trillion. Comparing the unadjusted stablecoin volume and even the adjusted ones to these figures shows the direction in which this is heading: a complete transformation of how money moves. As Friedrich Nietzsche said, “The snake which cannot cast its skin has to die. As well, the minds which are prevented from changing their opinions; they cease to be mind.” Our TradFi system seems ready to cast its skin.
Casting somebody else’s skin, on October 14, 2025, the U.S. Department of Justice (DOJ) announced the largest civil forfeiture action in its history: the seizure of approximately 127,271 Bitcoin (BTC), valued at around $15 billion at the time, linked to Chen Zhi (also known as “Vincent”), a 38-year-old Cambodian national and founder and chairman of the Prince Holding Group. The funds were obtained through ‘pig butchering‘ scams – fraud schemes in which scammers build fake relationships online to lure victims into bogus cryptocurrency payments. The operation involved at least 10 forced-labor compounds in Cambodia, where trafficked workers, often lured with fake job offers, were held in prison-like conditions, beaten, and forced to execute scams targeting victims in the U.S., Europe, and elsewhere. These scams stole billions, with proceeds laundered through shell companies, bitcoin mining (such as via Warp Data Technology in Laos), and luxury purchases like yachts, private jets, and even a Picasso painting.
The question is: How did the DOJ gain access to Chen’s private keys, which he apparently controlled personally? Chen is still at large, so the DOJ could not have compelled him to share them. Instead, the keys were likely obtained through internal evidence seized from Prince Group operations. FBI investigations reportedly uncovered ledgers, photos, and operational files (such as scam scripts and profit trackers) from compounds and executives. These included “Chen Zhi’s own records of private keys and seed phrases” stored insecurely – possibly on cloud services, hard drives, or shared devices. This is reminiscent of the 2022 Bitfinex hack recovery, where keys were found in plain text on a suspect’s cloud account; poor key hygiene enabled access. Once the private keys were secured, the DOJ transferred the BTC to government wallets, freezing it under forfeiture law. Supporting the DOJ were blockchain forensics and tracing tools from Chainalysis and Elliptic that mapped inflows from scam victims and mining pools to Chen’s addresses.
This case highlights vulnerabilities in self-custody, such as insecure key storage, and demonstrates the power of blockchain tracing in law enforcement. As Chainalysis stated in their 2025 Crypto Crime Report: “The $15 billion seizure underscores a brutal lesson: private keys stored in operational records, cloud accounts, or shared devices are not private. True self-custody demands air-gapped, encrypted, and offline key management– anything less invites seizure or theft.” To emphasize the importance of this, here is Tether CEO Paolo Ardoino: “If you’re not losing sleep over how your private keys are stored, you’re doing it wrong. Extreme care isn’t optional– it’s survival.” Finally, this quote is from a 2024 internal memo of the U.S. Secret Service titled ‘Cryptocurrency Seizure Guidelines’: “Treat private keys with the same paranoia as nuclear launch codes. Any exposure– screenshot, cloud sync, unencrypted note, or shared drive– renders self-custody meaningless.” In any case, please take this really seriously.
The World of Commodities
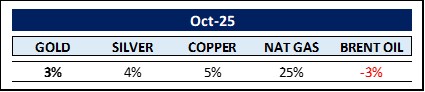
Silver finally broke through its all-time high (ATH), reaching $54.47 per troy ounce on October 17, 2025. The previous all-time high for silver prices occurred on January 18, 1980, when the spot price reached $49.45 per troy ounce. For context, silver started 1979 at around $6 per ounce, representing a staggering 724% increase in just over a year. That surge was overwhelmingly driven by the aggressive accumulation of silver by the now-infamous Hunt brothers. To match the real value of silver’s 1980 peak, the troy ounce would have to hit approximately $196 in 2025 dollars, as the US dollar has lost 77% of its purchasing power in the last 45 years.
Will it ever reach $196 per troy ounce? Let’s look at some fundamentals: In 1792, the US Congress established its monetary system and decided to mint coins made of gold and silver. At that time, it took 15 ounces of silver to buy 1 ounce of gold – the gold / silver ratio (GSR) was 15. At the beginning of the 20th century, governments around the world stopped backing their money with gold. People started hoarding gold, which drove up its value. During the Great Depression, the GSR rose to 71. Since 1970, the average ratio has been about 60. Today, you need about 84 ounces of silver to buy 1 ounce of gold. This imbalance is calling for a reversion to the mean. Will gold explode even higher, or will silver leap to new highs? The supply side favors silver: According to the World Silver Survey 2025, mines will produce around 835 million ounces this year. Recycled silver will add another 193 million ounces. However, total demand is expected to reach around 1,150 million ounces, meaning the supply side is roughly 122 million ounces short. If this holds true, 2025 will be the fifth year in a row in which demand exceeds supply, paving the way for further price increases. While still a long way from reaching $196, the supply and demand picture supports rising prices for the poor man’s gold.
After the end of the gold standard in 1971, soaring U.S. interest rates, falling gold prices, and the emergence of the petrodollar system pushed central banks towards U.S. Treasuries. Now, for the first time since 1996, non-U.S. central banks’ gold reserves (24%) have surpassed their U.S. Treasury holdings (23%). Although this is still a far cry from the 48% of non-U.S. central bank reserves held in gold in 1970, it remains notable. Persistent gold buying and rising U.S. debt risks appear to be reshaping reserve composition toward hard assets.
Let’s move on to energy, especially natural gas given its price explosion in October. Every major natural gas demand driver – data centers, electrification, and LNG exports is surging, while dry gas supply remains stagnant. It really is that simple. According to Citrini Research, some experts expect about 35 Bcf/d of demand growth from high-confidence LNG and power generation needs over the next decade. Others believe this is far too low, projecting demand growth could reach around 70 Bcf/d.
There are two key supply sources: dry gas production (mainly from Appalachia and the Haynesville in Louisiana) and associated gas production (gas produced from oil wells, almost entirely in the Permian Basin). Together, these account for roughly 70% of US Lower 48 gas production. At current NYMEX forward pricing, experts expect 15–20 Bcf/d of supply growth. Compared to above high-confidence demand growth forecast of about 35 Bcf/d, it becomes clear that the natural gas market is at a fundamental inflection point.
Dry gas production in Appalachia (the Marcellus and Utica formations), which drove most of the growth over the past decade, has plateaued for several years. Associated gas from the Permian will continue to grow, but it is not enough to meet the surge in new demand. The supply side of the market will become increasingly elastic, while demand becomes inelastic. Price-pass-through demand (such as LNG exports under long-term offtake agreements) and new inelastic demand (such as hyperscaler power generation) continue to dominate incremental consumption. This mismatch is a perfect recipe for higher prices.
Over the past decade, associated gas – with an incremental cost of about $0 – has been the balancing factor in gas markets. Going forward, associated gas will no longer play this role, and consumers and exporters will have to start paying for growth when they need it, structurally shifting the US natural gas market from supply-push to demand-pull.
December crude oil prices drifted lower into mid-October, reaching levels not seen since early May, but then rallied sharply after news of new U.S. sanctions targeting Russian oil producers Rosneft and Lukoil hit the markets. These companies account for about 5% of global oil supply and nearly half of Russia’s seaborne oil exports. However, the rally was short-lived; analysts quickly noted that ample global stockpiles and alternative flows from the Middle East and U.S. Gulf Coast would limit disruptions, with prices widely expected to normalize by November. This episode highlighted the commodities market’s sensitivity to geopolitics, turning a routine sanction into a multimillion-dollar margin play that faded as quickly as it flared.
The top three commodities in October were Cobalt (+39%), Sulfur (+25%), followed by Natural Gas (+25%). The bottom three start with Orange Juice (-26%), followed by Neodymium (-13%) and Ethanol (-13%).
The Rest …
Why are bond traders who make their living betting on rising or falling US Treasury bonds referred to as smart money incarnate? The US Treasury bond market is widely regarded as the most important bond market globally. Given the recent geopolitical, economic and social horror stories, one would expect yields to rise significantly to offset the perceived heightened risks. After all, if the yield is high, it means traders expect debt to be risky and expensive. And when it’s low, it means rather free sailing. In reality though, the yield was 4.57% on December 31, 2024 and is now about 10% lower. This shows us that the smart money is not afraid of any near-term financial turmoil or a recession at all.
Wall Street pundits couldn’t get enough of their recession forecasts at the beginning of the year. I guess the fearmongering was to no avail. This leaves us with the question: What actually causes recessions? There appear to be two primary reasons. The first can be ascribed to the actions of central banks. They often keep rates too low for too long and are then forced to overcompensate by keeping them too high for too long. This squeezes economic activity and puts pressure on overleveraged businesses. Eventually, a major bankruptcy puts pressure on lenders, who then call in loans, exacerbating the problem for other businesses. This leads to higher unemployment and less spending, which affects otherwise healthy businesses and confirms a recession.
The second cause is a surge in energy prices. If oil prices rise sharply and remain high for more than a few weeks, it acts as a tax on consumption. This forces decisions about whether an activity is economically viable and if the reward outweighs the increased cost. Usually, the most vulnerable parts of the economy bear the brunt of this pressure, which can serve as a catalyst for broader issues.
Neither of these recession causes seems imminent, which may explain the current smart money positioning.
Stock markets, especially the US ones seem frothy though. As of 31 October 2025, the NASDAQ Composite’s total market capitalization is approximately $34.5 trillion. This is based on the index’s recent closing value of around 23,723 multiplied by an estimated aggregate divisor of roughly 1.455 billion shares. For context, the US M2 money supply (M1 plus “near-money” assets that are highly liquid but not as immediately spendable – savings and time deposits) is $22.195 trillion (August 2025, seasonally adjusted), while nominal annualized US GDP is about $28.65 trillion. As a result, the NASDAQ currently stands at 156% of M2 and 120% of US GDP. During the Dot-Com peak, these ratios reached 131% (M2) and 140% (GDP), respectively. Thus, valuations are at the very high end of the historical range, this time mainly driven by AI-related capital spending. The NASDAQ is already at a record level relative to M2, while it still has some wiggling room compared to GDP.
Then again, it does not make much sense to directly compare the dot-com stock market bubble to the current AI investment boom because the underlying contexts and dynamics differ significantly. The dot-com bubble was characterized largely by speculative investment in internet startups with limited revenues, driven by hype and often inflated or fraudulent valuations, and many companies eventually failed. In contrast, today’s AI investment boom involves foundational technology impacting multiple technology layers and industries, backed by profitable large tech firms reinvesting significant capital into real infrastructure and innovation. AI companies are demonstrating substantial revenue growth and integration into enterprise, government, and various other sectors, unlike many dot-com companies, which had little or no revenue. Thus, while some superficial similarities exist, the AI investment environment represents a more mature and sustainable technological and economic phenomenon that is expected to evolve over years rather than being an ephemeral speculative bubble.
In view of above record-breaking spending on AI infrastructure, will the ever important “Compute“ become the currency of the new AI-driven world? Whether measured in exahashes per second or in gigawatts, compute has become the essential commodity of the 21st century, according to Frank Holmes, executive chairman of HIVE Blockchain Technologies. Just as crude oil powered the industrial age, compute now powers the digital age. Compute is closely tied to energy costs, and future grids using renewables or fusion could make “green compute” a premium asset, attracting early investment.
Consequently, international commercial real estate giant CBRE’s recent survey of 92 major investors worldwide found that the data center sector is experiencing surging demand from institutional capital. 95% of survey respondents plan to increase their data center investments this year. 41% of respondents plan to allocate $500 million or more in equity to the data center sector this year, up from 30% in 2024.
This indeed raises the question: will compute become the main currency of the future? AWS, Google Cloud, and Microsoft Azure already charge per compute hour quickly evolving toward spot markets. Blockchain projects such as Render Network, Golem Network, and Akash Network are by now treating compute as tradable units. However, while compute will be a currency of the AI era – traded, tokenized, and pivotal – it will not be the universal one. It complements rather than replaces traditional money, much like bandwidth became vital for the internet without becoming cash. Rather as Jensen Huang, CEO of NVIDIA, states: “Compute is the new currency of intelligence. The more compute you have, the more capable your AI systems become – it’s not just about data or algorithms anymore; it’s about who can harness the raw power of silicon.”
AI is set to change the world as we know it. The US and China are in a head-to-head race to be the first to introduce AGI (Artificial General Intelligence), which insiders anticipate could happen as soon as next year. AGI represents a monumental leap beyond today’s narrow AI systems, which excel at specific tasks but lack true versatility, reasoning, and autonomy. Current AI (GPT-5, Llama 3.1, Grok Ultra, DeepSeek-R1, etc.) operates within predefined boundaries, relying on pattern-matching from vast training data, while AGI would possess human-like – or even superior – cognitive flexibility across any intellectual domain.
Current AI is like a toolbox: powerful for specific jobs but useless without a human carpenter. AGI is the master craftsman – it builds new tools on the fly, learns any trade instantly, and evolves the toolbox itself. This results from integrated intelligence, combining reasoning, memory, perception, and action in one system. Nobody knows where this is heading. As Peter Diamandis recently put it: “We’re at a crossroads. AI can create a Star Trek future of abundance and amplified human potential – or a Mad Max wasteland where humans are obsolete.” Or, as Forbes calls it, “humanity’s final invention.” After all, we’re talking about factories run by intelligent machines. These self-programming robots will have AI systems that invent new materials, novel medicines, and innovative energy sources faster than any human team ever could. Abundance or wasteland?
In any case, the race to AGI (and then ASI – Artificial Superintelligence) will consume unprecedented amounts of energy. Just how much has not yet been determined. Sam Altman shocked the world when he recently stated that OpenAI has the “audacious long-term goal” of securing 250 gigawatts (GW) of power generation capacity by 2033 for its AI data centers. To put that figure in context: that’s nearly 5x the power used by all of Germany (53 GW on average in 2024) and about one-fifth of America’s current total electrical generation capacity (1,300 GW). And that’s just a single company. It’s important to remember that if OpenAI does it, xAI will need to add 250 GW. Google will need to add 250 GW. Microsoft will have to add 250 GW. Meta will have to add 250 GW. And that doesn’t include Amazon, Alibaba, Oracle, or the new generation of GPU-driven cloud service providers like CoreWeave and Nebius. Nor does it include sovereign AI initiatives from countries like Saudi Arabia, India, the UAE, or Britain. Each is racing to build its own national AI models and infrastructure. Add it all up, and we’re facing a global power shortfall of historic proportions.
Or as Jesse Jenkins, Princeton University energy systems researcher, put it: “The scale of the electricity shortfall is staggering – hundreds of gigawatts missing by 2030 if we don’t act. This isn’t a gap; it’s a chasm of historic magnitude.”
What could cover the shortfall? Wind and solar? Probably not. Oil, coal, and gas? Perhaps for a transitional period. Nuclear? More likely, especially after the May 2025 Executive Order #14299, “Deploying Advanced Nuclear Reactor Technologies for National Security.” After being stigmatized and stifled for years, the urgent need for much more baseload power has changed minds in Washington. It appears that safe 4th generation SMEs (small modular reactors) will finally have their moment soon. Here, TerraPower – with investments from Bill Gates and NVIDIA – seems furthest along the path to success.
In the mid- to long-term, all hope is placed on clean fusion technology, for instance as developed by Commonwealth Fusion Systems (CFS). If you think fusion is just a fairy tale, then why by all means did Italian oil giant ENI just invest $1 billion in a power off-take agreement with CFS? I have long believed in the diverse approaches to harnessing the power of the sun through fusion technologies and trust we will see real-world applications sooner than many think possible. Here is Dr. Michio Kaku: “Controlled fusion is the ultimate energy source. It promises to be inexhaustible, carbon-free, and capable of powering civilization for millions of years.” And Dr. Tammy Ma, Lead for Inertial Confinement Fusion, Lawrence Livermore National Lab: “Fusion has been ‘30 years away’ for 70 years—but now, with lasers, magnets, and AI, we’re finally closing in on the dream of bottling a star.”
MAKE-IT CAPITAL FUND (the Fund)
- As a unique hedge fund for a comprehensive blockchain / cryptocurrency portfolio, the Fund allows investors to participate in the full spectrum of distributed ledger / crypto assets with just one investment.
- The Fund aims to reduce inherent risk and volatility without compromising performance by applying its proprietary 5-pillar strategy.
- The Fund is operated by Make-It Singapore and managed by Make-It New Zealand.
- The Fund is fully transparent and always trades at the exact NAV.
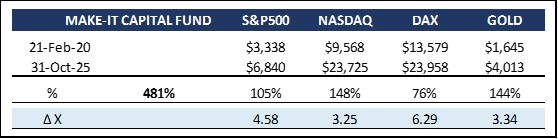
The Make-It Fund was unable to withstand the wave of selling triggered by orange swans this month. In addition to encountering these graceful birds, we can now see in hindsight that we may have gotten involved with some altcoins too early. Nevertheless, we remain convinced of their merit for the emerging Web3 agency economy. Let’s hope we don’t find ourselves in a swan lake that is as colorful as it is unpredictable anytime soon.
Be that as it may, we remain very optimistic about crypto markets in general, and especially for 2026. Why? Here are just a few catalysts providing strong tailwinds. First, there is the CLARITY Act. Once the lockdown is resolved and Congress is back in session, we should expect to hear a definitive timeline for the passage of this crucial piece of legislation. Further, what was unimaginable even 12 months ago is becoming reality. JPMorgan Chase is accepting Bitcoin and Ethereum as collateral. Citibank is partnering with Coinbase to build stablecoin infrastructure. And IBM is diving into crypto by unveiling a new custody platform. The momentum continues. It may not feel that way, however, it seems we are still in the first inning.
There is so much to look forward to.
Thank you for your time and attention.
Here is the promised link to the a16z report ‘State of Crypto 2025’:
https://a16zcrypto.com/posts/article/state-of-crypto-report-…
Sincerely,
Philipp L.P. von Gottberg